Sooner or later, every inspection raises two questions. Can you prove where the measurement was taken? And can you trust that record years from now, without sending someone back to the field to check? When a regulator, insurer or internal auditor asks why a circuit’s next inspection date changed, “we checked it” isn’t an answer. You need the exact location, the date, what was found, and how the condition has changed since.
That's where modern asset inspection software is shifting. Laser scans and 360° imagery now give inspection teams a measurable, browsable record of the plant as it actually stands. In this article, you’ll see how 3D scan data and 360° imagery cut unnecessary field visits and help teams plan before anyone goes on site. You’ll also see how they build the inspection traceability and audit trail you need to prove an inspection years later.
Why integrity teams don’t fully trust remote inspection data
Most integrity teams already work partly remotely. Inspectors send photos, thickness readings land in a spreadsheet or an inspection data management system (IDMS), and engineers review findings from the office. The real question is whether anyone trusts that data enough to decide without going back to look. Usually, the weak link is location.
A photo shows a corroded elbow. It doesn't show which elbow, at what elevation, next to which support. Isometric drawings help, but on older units they often lag years behind modifications. The result is familiar to anyone who runs a turnaround:
- Inspectors spend the first hours of a site visit finding the inspection locations they’re meant to measure (CMLs, TMLs or monitoring points, depending on your program)
- Readings get logged against the wrong inspection location, which corrupts corrosion-rate trends
- Planners can't confirm access needs (scaffolding, insulation removal, rope access) without sending someone to look.
- When an auditor asks for evidence, the record is scattered across email, shared drives and personal photo folders.
Raw point clouds solve part of this, since they capture geometry with survey-grade accuracy. But they're heavy, they need desktop software and a specialist to open, and most of the people who need the information never see them. Data that only one person can read doesn't create a shared source of truth. It creates another silo.
How 3D scan data reduces field visits and speeds up each check
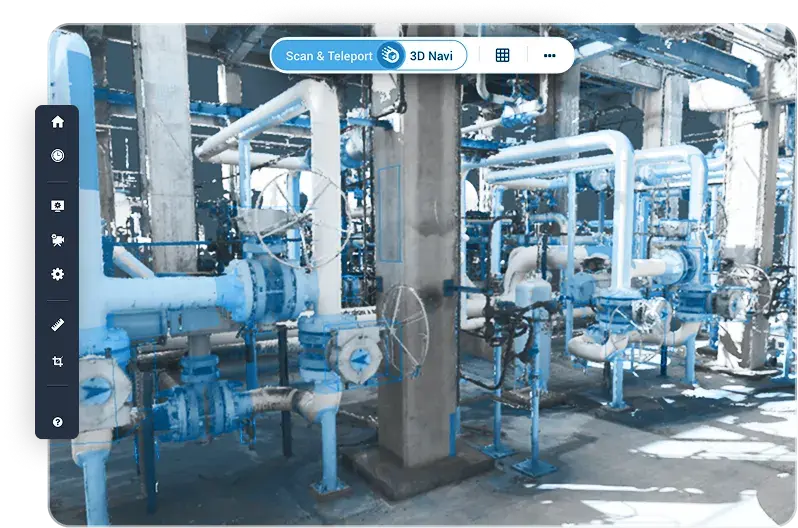
A laser scan records every pipe, vessel, support and nozzle in a unit as it actually stands on the day it was captured. Turned into a browsable visual twin, it gives your whole team the same view of the plant without anyone booking a site pass.
Here's what that changes for an integrity team.
Plan before anyone goes on site. Engineers walk the unit virtually, measure clearances and confirm scaffolding, insulation removal or rope access needs from the office. Decisions get made before personnel enter the field, and the site visit becomes a focused job instead of a scouting trip.
Trust what you’re looking at. Distances, elevations and dimensions come straight from the scan. When an inspector flags a defect, the reviewer sees it in place, at full resolution, with its surroundings.
Inspection history in one place. Scans captured on different dates can be compared to spot deterioration or confirm that repairs were completed. Instead of digging through shared drives, you open the location and see how it looked at each inspection. Cintoo’s Twin Edition supports this kind of comparison for operating facilities.
Access to everyone who needs it. Cintoo converts terrestrial, mobile and drone scans into lightweight, high-resolution meshes, typically 10 to 20 times smaller than the source point clouds. Teams stream them in a web browser, so a corrosion engineer, a planner and a contractor can all review the same location without specialist desktop software.
Why 360° imagery matters alongside the scan
A laser scan gives you geometry you can measure. 360° imagery adds what geometry can’t show: the condition of insulation and cladding, staining around a support, a missing or unreadable line label, a blocked access route, or equipment parked where the scaffold needs to go.
With 360 Edition, reviewers can switch between the laser scan and 360° photos of the same spot. Transparency controls also let them compare scans, models and 360 captures side by side. A lightweight camera such as the Ricoh THETA X captures a unit quickly. Teams can then refresh the visual record between full scan campaigns and give each inspection location dated photo evidence on top of its measurable geometry.”
The transparency controls and Ricoh THETA X come from your product update and event posts. The toggle wording comes from your writer’s comment, so confirm it before publishing.
The point isn't to replace site visits. Some readings will always need a probe on steel. The point is to make every visit count, and to stop paying for the ones that only exist to look.
Does 3D scan software support inspection traceability and compliance audit trails?
Short answer: yes. 3D scan data becomes the spatial and visual evidence layer of your audit trail. It works alongside your IDMS rather than replacing it. Your IDMS stays the system of record for thickness readings, corrosion rates and inspection intervals under codes such as API 570 and API 510. Cintoo answers the questions the IDMS can’t: where exactly the inspection was performed, what the area looked like on that date, who reviewed it, and how the condition has changed since. That’s what lets you prove an inspection digitally, years after the crew left site
Inspection traceability: every location has an address in the scan
In Cintoo’s Twin Edition, each inspection location can be represented as a tag. Each tag carries a unique ID, an XYZ location and a bounding box in the as-built scan, plus custom metadata. That metadata can include the location ID, circuit, material class and a hyperlink straight to the matching record in your IDMS, ERP or EAM platform. Cintoo supports up to 50 custom metadata fields per tag list.
This gives you a two-way link. From the IDMS, an engineer clicks through to the exact spot in the visual twin. From the visual twin, an inspector clicks a tag and lands on its reading history.
Tag lists don't have to be built by hand. They can be imported from a CAD model or digital twin and adjusted to match reality, updated in bulk through the Cintoo API, and accelerated with Cintoo's AI Engine for tag geolocation and classification. Lists can also be exported with the scan view for each tag, which is useful for work packs and contractor briefings.
Audit trails: who saw what, when, and what they decided
Traceability covers the "where". An audit trail also needs the "who" and "when".
Cintoo supports this in four ways:
- Dated evidence over time. Every scan and 360° capture carries its capture date. You can show what an inspection location looked like at each inspection, not just the most recent one
- Annotations tied to location. Notes, issues and measurements are pinned to the exact spot in the scan. Issues carry a title, description, assignee and due date.
- A project activity record. The Report tab lists activity by work zone, with the date created, object name and creator for each item. Filtered reports export as PDF, ready to attach to an inspection file or an audit response.
- Controlled access. Role-based permissions separate who can view, create or manage tags and annotations. Cintoo is SOC 2 Type 2 compliant, ISO 27001 certified and GDPR-compliant, which matters when scan data covers critical infrastructure.
- Capture. The unit is laser scanned, and 360° imagery is added for areas that change often, so reviewers can check insulation, supports and labels between scan campaigns.
- Tag. Inspection locations are imported as a tag list from the existing CAD model, then adjusted to sit on the as-built geometry. Each tag links to its IDMS record.
- Plan remotely. Planners measure access heights and flag scaffolding needs directly in the scan. Issues are assigned with due dates, and the team decides which locations genuinely need a site visit.
- Inspect on site. Crews receive a tag export with a scan view of each location, so they go straight to the right location.
- Review and record. Findings are logged as annotations at the exact spot. Readings go into the IDMS as usual.
- Respond to audits. A filtered Report tab export, plus the linked IDMS records, answers the auditor's question in minutes.
Issues can also be pushed to Autodesk Construction Cloud where project teams already track work there.
What stays in your IDMS
Be clear with your auditors about the split. Thickness readings, calculated corrosion rates, remaining life and next inspection dates belong in your IDMS. Cintoo holds the visual evidence and spatial context, and links to those records.
| Audit question |
Where the answer lives |
| Where is inspection location 4-117 physically located? |
Cintoo tag (XYZ + bounding box in the scan) |
| What did the area look like at each previous inspection? / Cintoo scans and 360° captures, compared by date |
Cintoo scans compared by capture date |
| Who flagged the finding, and when? |
Cintoo annotation + Report tab, exported as PDF |
| What was the measured thickness and corrosion rate? |
Your IDMS, linked from the Cintoo tag |
| Who can view or change this data? |
Cintoo roles and permissions |
What a scan-backed inspection cycle looks like
Take a typical scenario: a refinery integrity lead preparing the external inspection of a crude unit piping circuit ahead of a planned shutdown. This is an illustrative workflow, not a customer case.
Before: The team pulls isometrics, some of them outdated. An inspector spends a day on site locating inspection points and photographing access issues. Back in the office, photos are renamed and filed by hand. Two months later, an auditor asks for evidence on a CML whose reading looked anomalous. Someone spends an afternoon searching for email.
With a scan-backed workflow:
The next scan, after repairs or at the next interval, becomes a dated comparison point. Over time, you build a visual history of the circuit that sits right next to the numbers.
What to look for in asset inspection software for remote work
If you're evaluating tools to add 3D scan data to your integrity program, these are the questions worth putting to every vendor:
- Can non-specialists open the data? If reviewing a scan needs a workstation and a trained user, your planners and contractors won't use it.
- Can each inspection location live in the scan with its own ID and metadata? Look for persistent tags with a location, not just screenshots with arrows.
- Does it link to your system of record? Hyperlinks and an open API matter more than a closed, all-in-one promise.
- Can you compare captures over time? A single scan is a snapshot. Dated comparisons are what turn it into evidence.
- Can you see the scan and 360° imagery of the same spot? Geometry proves position. Photos show the condition of insulation, supports and labels.”
- What does the audit export look like? Ask to see a real report, with dates and authors, in a format your auditors already accept.
- How is access controlled and certified? Check for role-based permissions and independent certifications such as SOC 2 Type 2 and ISO 27001.
- Is it independent of scanner hardware? Your scan fleet will change. Your inspection history shouldn't be locked to one vendor's format.
FAQ about Asset Inspection Software for Remote 3D Scan Inspections
Can 3D scan data prove where and when an inspection was performed?
Yes, as part of your evidence chain. Each inspection location is a tag with a fixed position in the scan. Annotations record who logged a finding and when, and dated scans and 360° captures show the condition at each inspection. Readings stay in your IDMS, linked from the tag.
Can 3D scan data replace on-site thickness measurements?
No. Scans capture geometry and visual condition, not wall thickness. They make on-site measurements faster and better targeted, and they document the context around each reading.
Is Cintoo an inspection data management system?
No. Cintoo is a visual twin platform. It works alongside your IDMS, linking each inspection location tag to its record so readings and spatial context stay connected.
How are inspection locations created in Cintoo?
As tags, created manually in the browser, imported from a CAD model or digital twin, updated in bulk through the API, or placed with help from Cintoo's AI Engine.
Can auditors see who recorded a finding?
Yes. Annotations and the Report tab show the creator and creation date, and filtered reports export as PDF.
Which Cintoo edition supports inspection location tagging?
Asset tagging at scale is part of Twin Edition