
Why 3D Data Visualization Matters in the Energy Sector
In high-risk, high-value energy environments, decisions can’t be made without the proper knowledge. Facility managers, engineers, inspectors, and executives all depend on reliable data to maintain asset performance, schedule maintenance, and plan capital improvements. That’s where a cloud platform for 3D data visualization in energy becomes not just beneficial, but transformative.
3D data visualization allows stakeholders across the enterprise to see and understand their infrastructure in real time, in spatial context, and from any location. Instead of relying on disjointed 2D drawings, outdated models, or verbal reports, stakeholders access a single, interactive environment that mirrors actual site conditions with millimeter accuracy. This visual clarity drives operational alignment, risk reduction, and faster decision-making.
Whether it’s a refinery, an offshore platform, a power generation facility, or a complex terminal site, energy infrastructure benefits from immersive 3D data environments. These digital views create a shared language between engineering, operations, and project management—one that fosters precision, speed, and collaboration.

What Does Visualization Enable Across Facility Maintenance?
Visualization in a cloud platform empowers maintenance workflows in several key ways. First, it allows for remote inspection and validation. Instead of dispatching teams to hazardous or remote areas, stakeholders can navigate through 3D site scans, validate the condition of assets, and determine access routes—all from a secure web browser.
Second, it provides instant access to spatial data for repair, maintenance or rework planning. Engineers can measure clearances, check alignment between mechanical components, and assess degradation such as corrosion or deformation. When visualization is paired with metadata asset tagging, maintenance teams gain full asset intelligence: not just where something is, but what it is, when it was last serviced, and what needs to happen next.

Most importantly, 3D visualization connects every stakeholder to a single source of truth. From planners to procurement to contractors, everyone sees the same up-to-date, verified model of the facility. This minimizes rework, reduces miscommunication, and accelerates response cycles in maintenance execution.
Key Capabilities in Cintoo's Visualization Platform
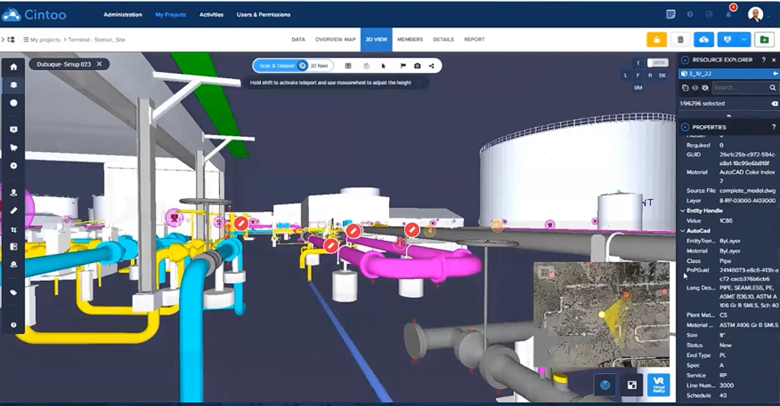
Cintoo stands out as a cloud-native solution built specifically for high-resolution 3D scan data visualization and collaboration. At its core, it transforms massive point cloud data into lightweight, streamable meshes using its proprietary TurboMesh engine. This allows complex laser scans of energy facilities to be viewed and navigated in real time—without sacrificing accuracy.
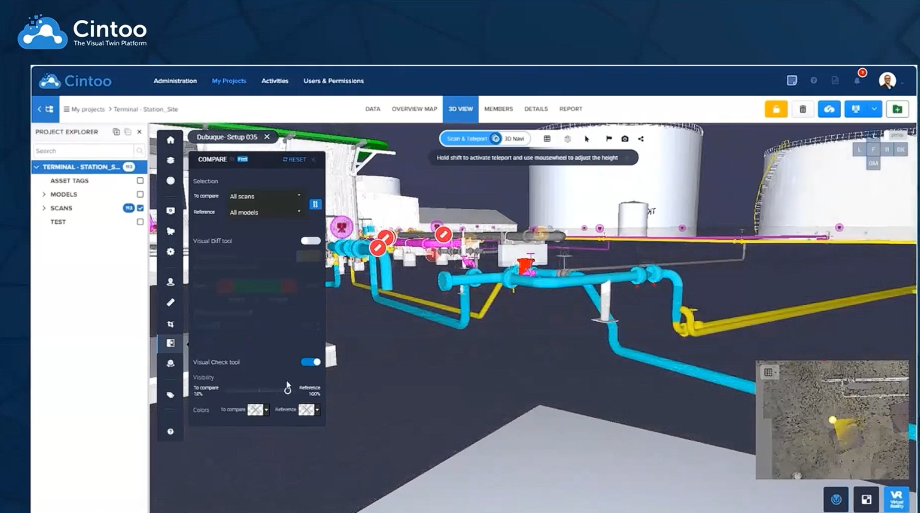
For energy decision-makers, Cintoo provides essential tools for interactive inspection, design validation, and team coordination. One of the most powerful features is the scan-to-model comparison tool, which allows users to overlay BIM/CAD models onto the scan data and instantly detect geometric deviations. This is invaluable during brownfield upgrades, where clash detection and alignment checks are critical.

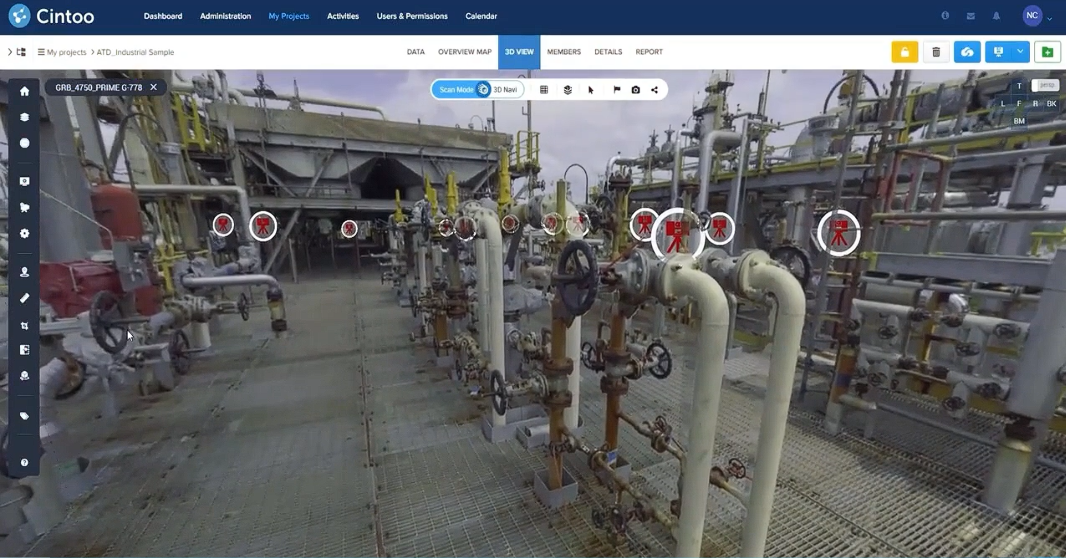
Cintoo’s teleportation tool enables users to move fluidly through the facility scan as if on a virtual walkthrough. Engineers planning retrofits can simulate site access or equipment installation, while safety officers can plan confined space entries or verify scaffolding locations. This immersive experience dramatically reduces the need for physical site visits.
The platform also features asset tagging and classification, allowing users to mark and categorize equipment such as valves, pumps, control panels, or structural supports. Tags are associated with metadata like inspection schedules, material specs, or ERP system IDs. This transforms the 3D mesh into an interactive database of asset intelligence.
Cintoo's project organization system enables facility teams to break large sites into zones or work packages. Users can isolate specific areas for analysis, collaboration, or QA/QC, streamlining the process for turnaround planning or regulatory inspection.
Most critically, Cintoo enables cross-functional collaboration. Project teams, engineering consultants, and contractors can log in from anywhere and work from the same visual environment. Engineers validating design intent, for example, can load the BIM/CAD model, compare it with the latest scan, and leave annotations for the design team—all within the cloud interface.
Visualization Use Cases in Energy
Visualization plays a central role in Scan to BIM workflows, particularly in brownfield facilities where design models must be validated against existing conditions. For example, in a recent BP project, laser scans from offshore platforms were uploaded into Cintoo, segmented by deck, and used to model pressure vessels, pipe spools, and walkways. Engineers then compared these as-built meshes with proposed designs, identifying deviations in anchor bolt locations before installation. This visual QA process avoided costly on-site rework.
In pipeline operations, visualization allows teams to perform remote assessments of long corridors, review valve pits, or inspect anchor supports without physically entering hazardous areas. When combined with asset tagging, operators can track inspection histories, identify areas of concern, and manage regulatory documentation.
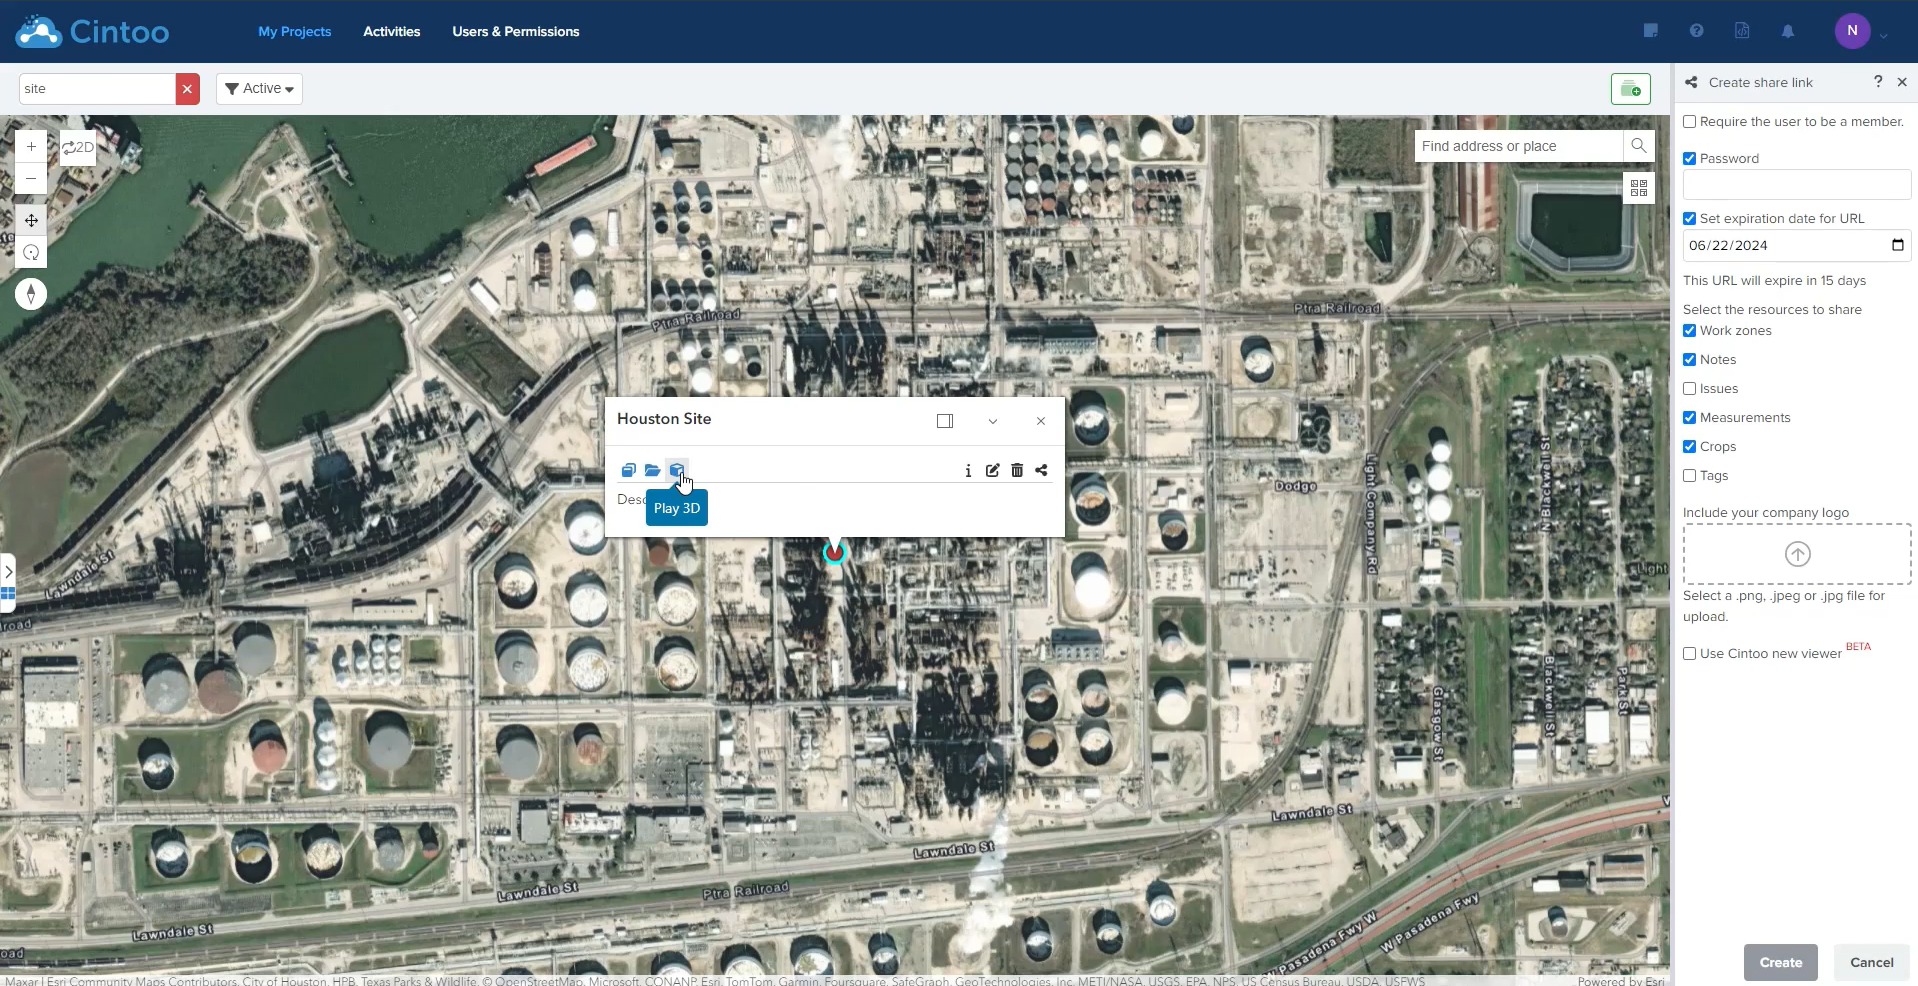
For terminals and refineries, cloud-based 3D visualization facilitates emergency response planning, shutdown execution, and vendor coordination. External contractors can be granted restricted access to specific project zones, ensuring data security while enabling high-quality collaboration.
Quantifiable ROI from Visualization
The return on investment from deploying a cloud platform for 3D data visualization in energy operations is tangible. Companies report a significant reduction in travel costs and risk exposure, since fewer field visits are required. For offshore and remote sites, this can translate into hundreds of thousands of dollars annually.
Visualization reduces project delays by enabling rapid issue resolution. Deviations between design and reality can be identified and corrected in advance, preventing last-minute field modifications. Faster planning cycles, improved stakeholder alignment, and reduced rework contribute to more predictable project timelines.
From a compliance standpoint, cloud-based 3D environments support digital traceability. Each inspection, annotation, and design validation is timestamped and linked to the scanned asset. This simplifies audit processes and ensures long-term documentation integrity.
Conclusion
A cloud platform for 3D data visualization in energy offers a foundational technology for smart facility management. From planning to inspection to execution, visualization empowers stakeholders to act faster, collaborate better, and manage complexity with confidence.
Cintoo’s platform delivers the critical capabilities needed to transform raw scan data into operational insight. With tools like teleportation, asset tagging, deviation analysis, and zone-based organization, it creates a true digital command center for energy infrastructure.
To experience how 3D visualization can optimize your energy operations, request a live demo today.